Market Morsel
This week saw the release of Australian Bureau of Statistics (ABS) data for livestock production in Australia and it showed the local cattle herd remains in a liquidation phase. It has prompted us to look across to the USA again to see how their cattle sector is faring currently regarding liquidation or rebuild, as they have been entrenched in a herd liquidation phase for the last five years and it begs the question – “are they nearing a rebuild”? The last time we looked, back in August 2024, they were still in liquidation but has the last few months seen any significant change of trend?
Unlike the ABS, which publish slaughter data quarterly, the United States Department of Agriculture (USDA) report their processing industry data on a monthly basis. A look at the US female slaughter ratio (FSR), an indicator that helps determine what phase of the cattle cycle is underway, shows that since the normal seasonal mid-year lull the US FSR has begun to climb again over quarter three of this year.
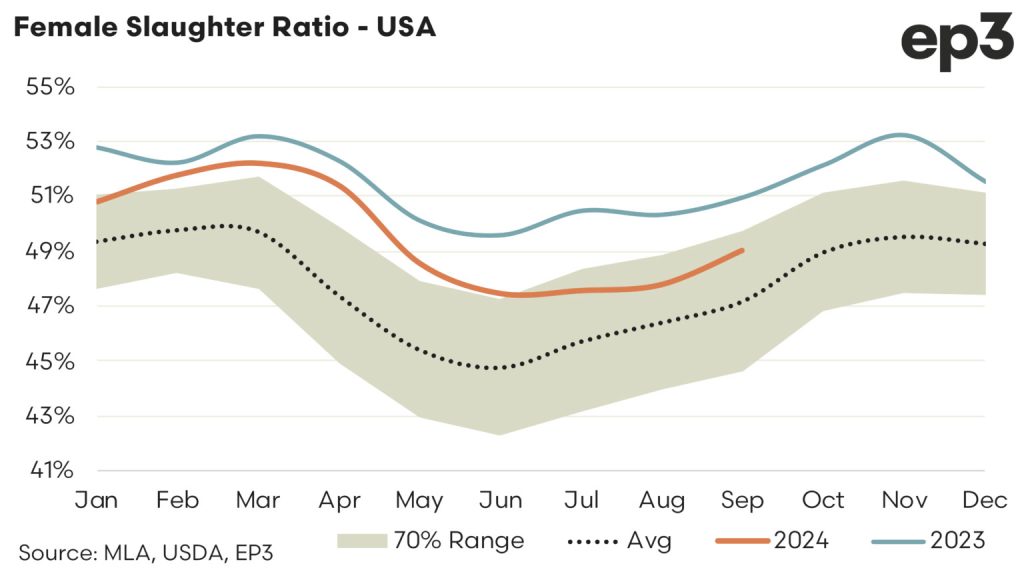
Indeed, since June 2024 the monthly US FSR has climbed from 47.4% to 49% as at the end of September 2024. Bearing in mind that historically the pivot point between rebuild and liquidation in the US herd in relation to the FSR is 47.5% a move back towards the high 40s for the FSR shows we are still trapped in a liquidation phase in the USA.
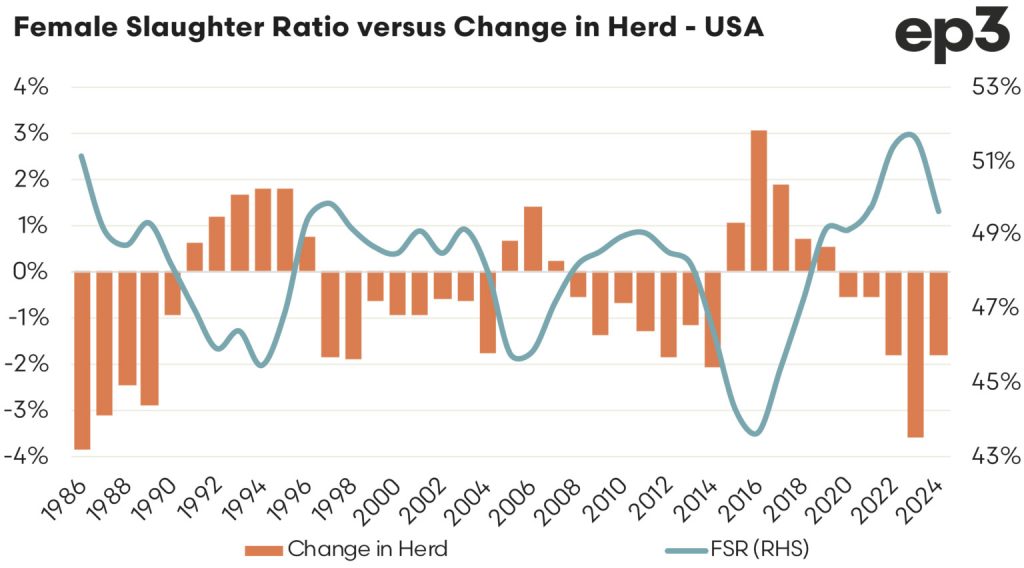
On an annual average basis the US FSR sits at 49.6%, as shown on the chart below, the trend in the annual average FSR has been downwards since the peak seen last year at 51.6%. So the US herd is slowly moving towards rebuild territory, it just isn’t quite there just yet.
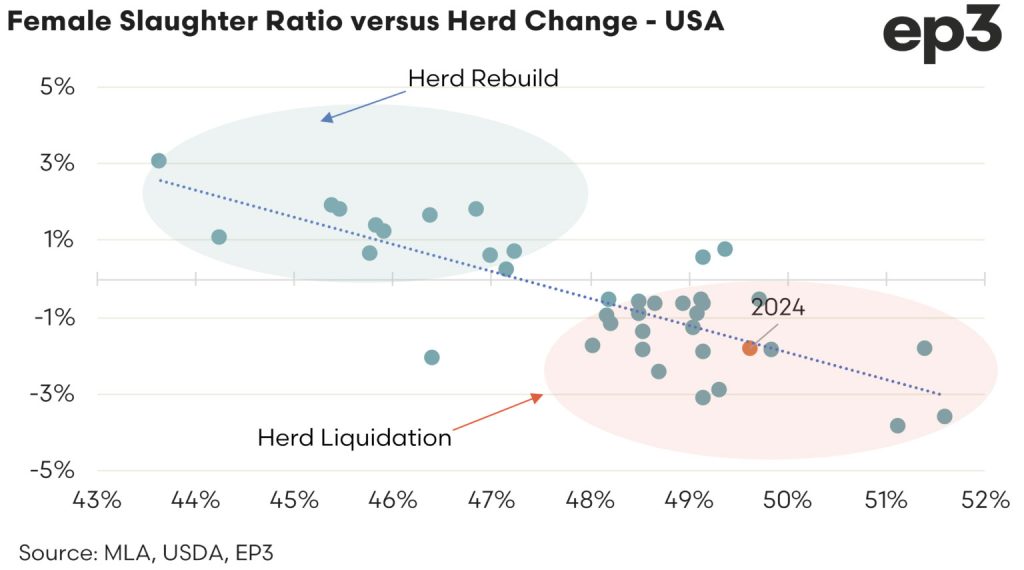
The scatter plot of the annual US FSR versus annual herd change clearly identifies the historic relationship between the FSR and the herd cycle. This scatter plot, demonstrating the link between the two variable since the mid 1980s to present, shows how clearly the 47.5% threshold determines which phase of the cattle cycle is underway in the US with only 3 of the last 42 years having an FSR level that didn’t align with the appropriate phase of the cattle cycle. In statistical terms, historically, the US annual average FSR level has correctly predicted which phase of the cattle cycle is underway more than 90% of the time.
Analysis of US cattle price changes versus stages in the cattle cycle also shows some interesting results. A look at the last century of US cattle cycles and price movements demonstrates the average pattern for price change through different parts of the rebuild or liquidation cycle. An assessment of historic US cattle cycles shows that, on average, rebuild and liquidation phases last around five to six years. Analysis of the average price pattern for the first three years of the cattle cycle to the last three years of the cycle demonstrates a clear difference in price behaviour, depending upon which phase is underway.
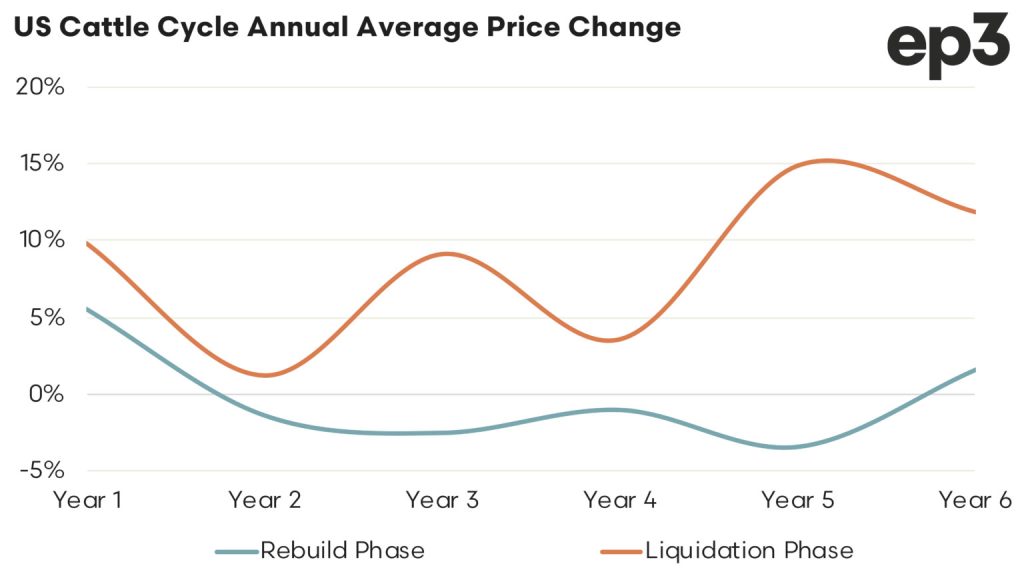
During much of the herd rebuild phase US cattle prices have close to a 50/50 chance of posting an increase or a decrease each season, such that the average price pattern across the period tends toward a sideways consolidation with a slight negative bias between years two to five.
However, during a liquidation phase the average trend has a definite bias toward increased prices, particularly in the later stages of the liquidation period. The ongoing reduction in the cattle herd during the liquidation phase likely results in tighter cattle availability toward the final stages of the de-stocking phase encouraging strong price support as supply dwindles. This is exactly what we are seeing presently with the US herd currently in its fifth year of liquidation and cattle prices nearing record levels.
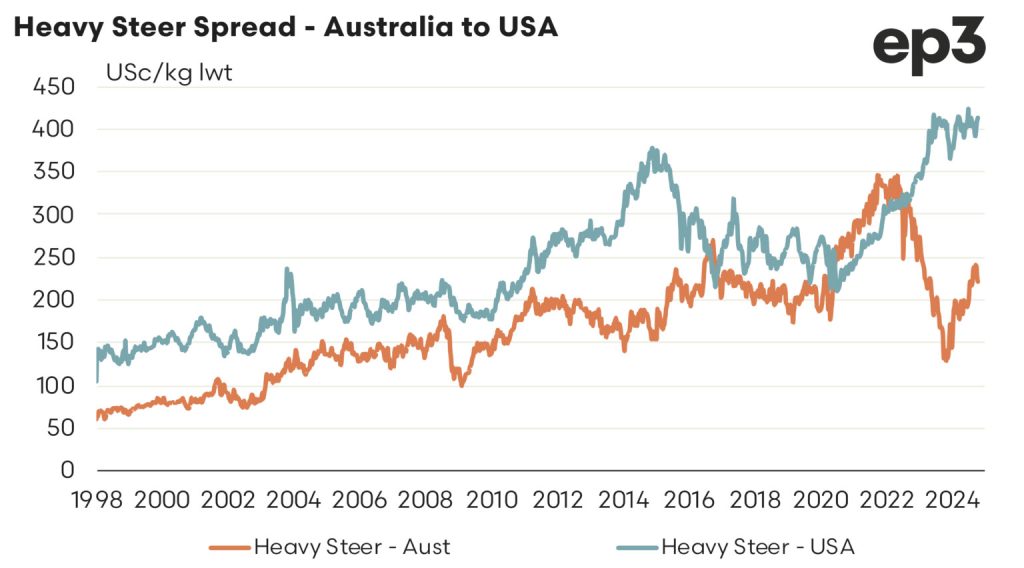
A comparison of US finished cattle prices versus Australian finished cattle prices highlights the wide discount spread in favour of Aussie cattle, making Aussie export beef more competitive into key markets where we compete with the US for market share, like Japan, South Korea and China. It is also encouraging strong penetration of Australian imported beef into the USA, with Australia moving to second top source destination this year for beef imported into the USA and the USA becoming Australia’s top beef trade destination.
A looming second Trump presidency has some in the Australian beef sector nervous about the prospect of a tariff being applied to Aussie beef imports into the USA. However, there is some historic form to suggest Trump may give a tariff reprieve on Aussie beef. Last time around Australian imports were exempted from punitive tariffs and Trump is also keen to drive down living costs for the US consumer. A good way to keep beef product affordable in the US would be to continue to allow tariff free access to Australian beef as it will be several years before US beef production and their cattle herd rebounds, even if they switch to a rebuild phase into 2025.


