Market Morsel
Recently we took a look at inflation adjusted pricing for sheep and lamb, converting the historic pricing going back several decades into current dollar values, so we could compare what is being paid for livestock now versus the values being paid in the past. This article does the same process of adjusting for inflation to see how cattle prices for both young cattle and heavy steers have held up over the years, once you convert the pricing into current dollar values.
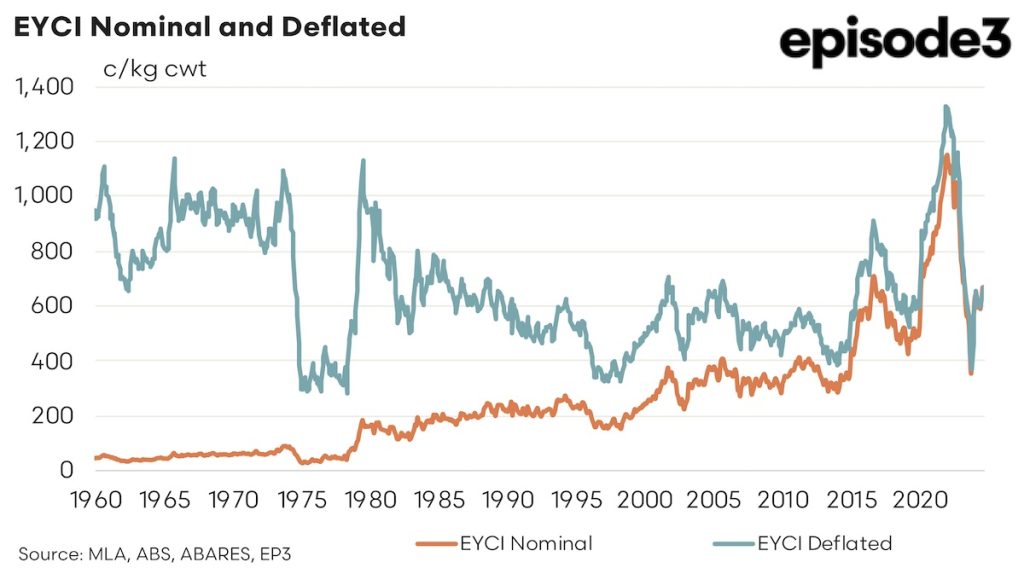
Using the current dollar adjusted values we can see that the EYCI peak at around 1,320 cents per kilogram carcass weight (cwt), which occurred at the end of 2021, was the highest young cattle prices have traded in Australia in real terms. This market rally in young cattle in the midst of a herd rebuild phase managed to outperform the previous inflation adjusted peaks seen before and after the cattle market crash of the mid 1970s that failed to crack the 1,200 c/kg cwt level.
A similar nominal versus deflated chart for the national heavy steer indicator is shown below. Interestingly, the most recent peak in current dollar value adjusted pricing for the heavy steer near the 1,000 c/kg cwt level was unable to match the price peaks seen prior the 1970s cattle market crash when the heavy steer traded to 1,200 c/kg cwt once the nominal prices of the 1970s were inflation adjusted to today’s dollar values.
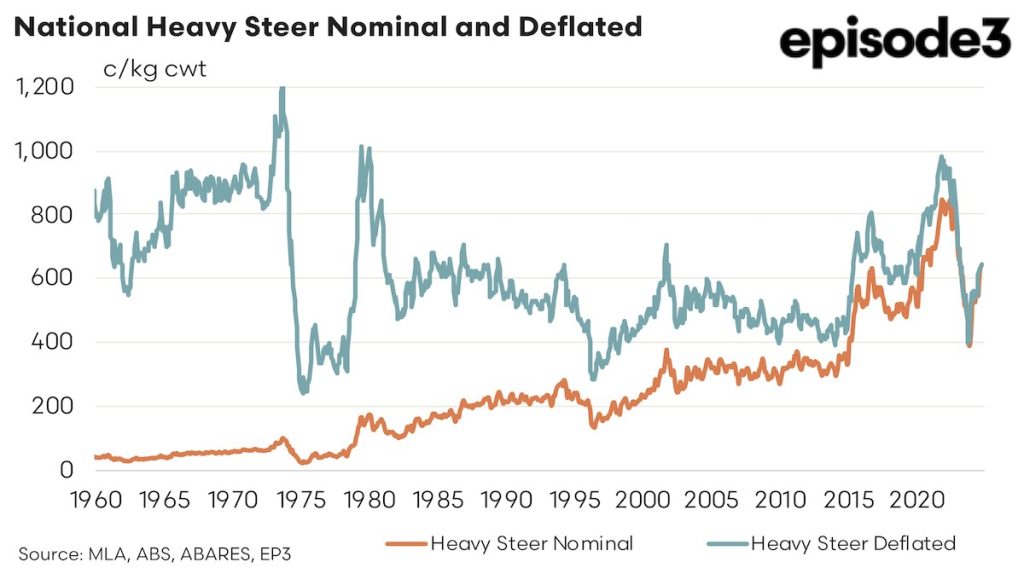
A dollar per head figure for young cattle and heavy steers can be determined from the deflated c/kg pricing assuming an average live weight of 300 kg for young cattle and 550kg live weight for heavy steers. For example an EYCI price of 675c/kg on a carcass weight basis works out to a live weight price of around 365 c/kg lwt or $1,095 per head if you assume the animal in question has a live weight of 300kg.
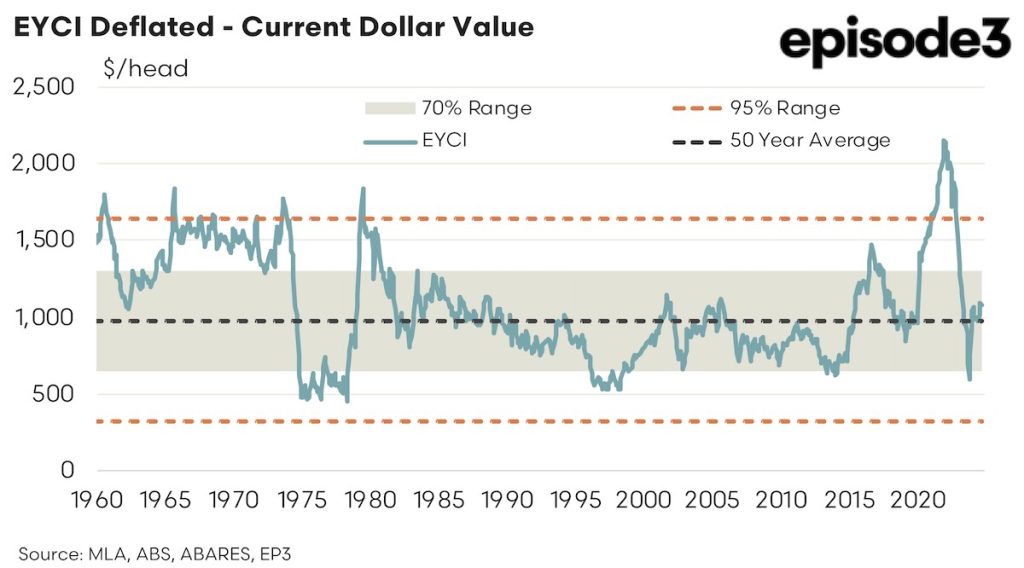
The same adjustment from cwt pricing to $/head can be calculated for heavy steers too so that a long term dollar per head pricing trend can be determined for both young cattle and heavy steers back to the 1960s all expressed in current dollar values. These $/head prices for the EYCI are shown on the chart below and with the application of some rudimentary statistical measures to the inflation adjusted historical EYCI pricing we can see that, for a 300kg young cattle, the long term average $/head price sits at around $980.
The 70% range, shown as a grey shaded area on the chart below, gives us an indication of the normal historical range in young cattle pricing which sits between $650 and $1,300 per head for young cattle weighing 300kg. Meanwhile the extremes in young cattle pricing are identified by the area beyond the two orange dotted lines. The upper extreme boundary sits at $1635 per head and suggests prices above this level for 300kg young cattle occur relatively rarely. It goes to show how extreme the pricing for young cattle was in late 2021 when 300kg young cattle were fetching around $2150 per head.
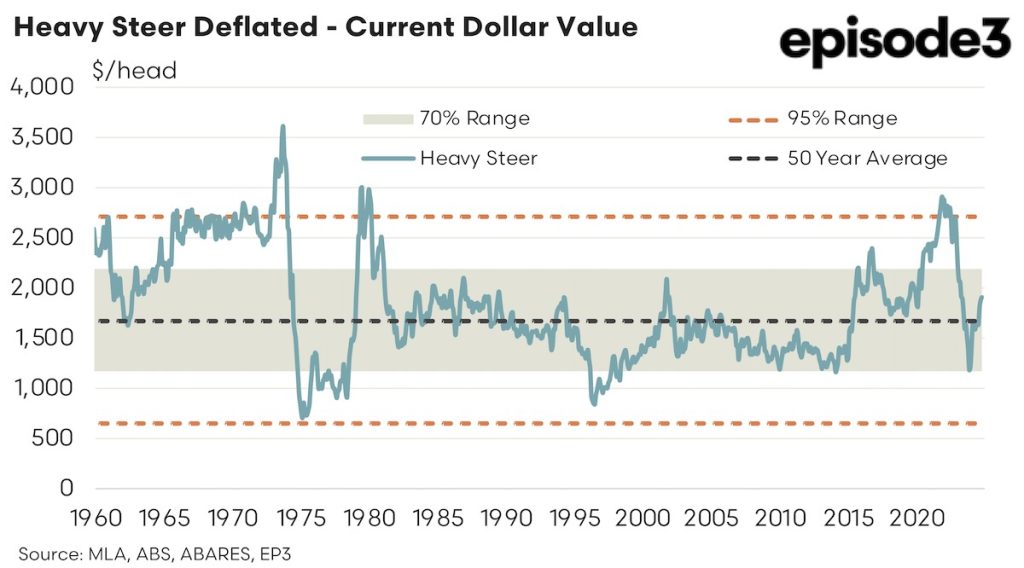
The extreme range in pricing for the heavy steer shows that the upper boundary sits at $2,700 per head and the lower boundary sits at $650 per head for a 550kg steer. At the most recent peak in pricing for the heavy steer the upper boundary was breached briefly and topped out at around $2,900 per head for a 550kg steer which is a far cry from the $3,500 plus per head pricing seen prior to the 1970s crash.
Currently the EYCI sits around 10% above its long term average pricing and the heavy steer is around 14% above its respective long term average pricing.
